Spotting the Warning Signs: Analyzing Patterns in Operator Reliability Reports
Written by Morgan Günther · Aug 19, 2026
Spotting the Warning Signs: Analyzing Patterns in Operator Reliability Reports
Operator reliability reports compile data on licensing status, payout timelines, dispute volumes, and regulatory actions across gambling platforms, and analysts examine these documents to identify recurring issues that signal potential problems for users. Patterns often emerge when multiple reports from different periods show consistent delays in processing withdrawals or repeated fines from oversight bodies, which creates a timeline that highlights operational weaknesses rather than isolated incidents.
Understanding the Structure of Reliability Reports
These reports typically organize information into sections covering financial stability metrics, customer service response rates, and compliance histories, while data points include average payout times measured in days and the percentage of resolved versus unresolved complaints. Observers note that cross-referencing entries from successive quarters reveals whether an operator has improved response protocols or if issues persist despite earlier warnings, and this longitudinal view helps distinguish temporary setbacks from systemic patterns.
Key Metrics That Reveal Trends
Figures on license suspensions or conditional renewals appear frequently in reports from bodies such as the New Jersey Division of Gaming Enforcement, and researchers track how often these actions coincide with spikes in player disputes filed through official channels. Data shows that operators with payout delay rates exceeding industry averages in three consecutive reporting cycles tend to attract additional scrutiny, whereas those demonstrating steady reductions in complaint volumes receive fewer follow-up audits. Analysts combine these metrics with information on third-party audit results to build a clearer picture of reliability over time.
Regulatory updates released in August 2026 highlighted several operators whose reports indicated a rise in unresolved account verification cases, and this development prompted closer examination of backend processing systems across multiple jurisdictions. Patterns in these cases often link to inadequate staffing during peak registration periods or changes in verification software that introduce new bottlenecks.
Identifying Recurring Warning Signs
One common indicator surfaces when reports list the same regulatory violation across different time frames, such as failures to maintain adequate responsible gambling tools or incomplete record-keeping on bonus terms. Those who've studied these documents find that clusters of similar infractions in reports from separate regions point to company-wide policy gaps rather than location-specific errors. Another pattern involves escalating fine amounts that double or triple between reporting periods, which suggests prior corrective measures failed to address root causes.

Reports from the Malta Gaming Authority document instances where operators received multiple warnings before license reviews, and these sequences appear in data sets that span several years. Analysts compare such timelines with similar records from Canadian provincial regulators to determine whether the issues reflect broader operational challenges or isolated compliance lapses in one market.
Methods for Pattern Analysis
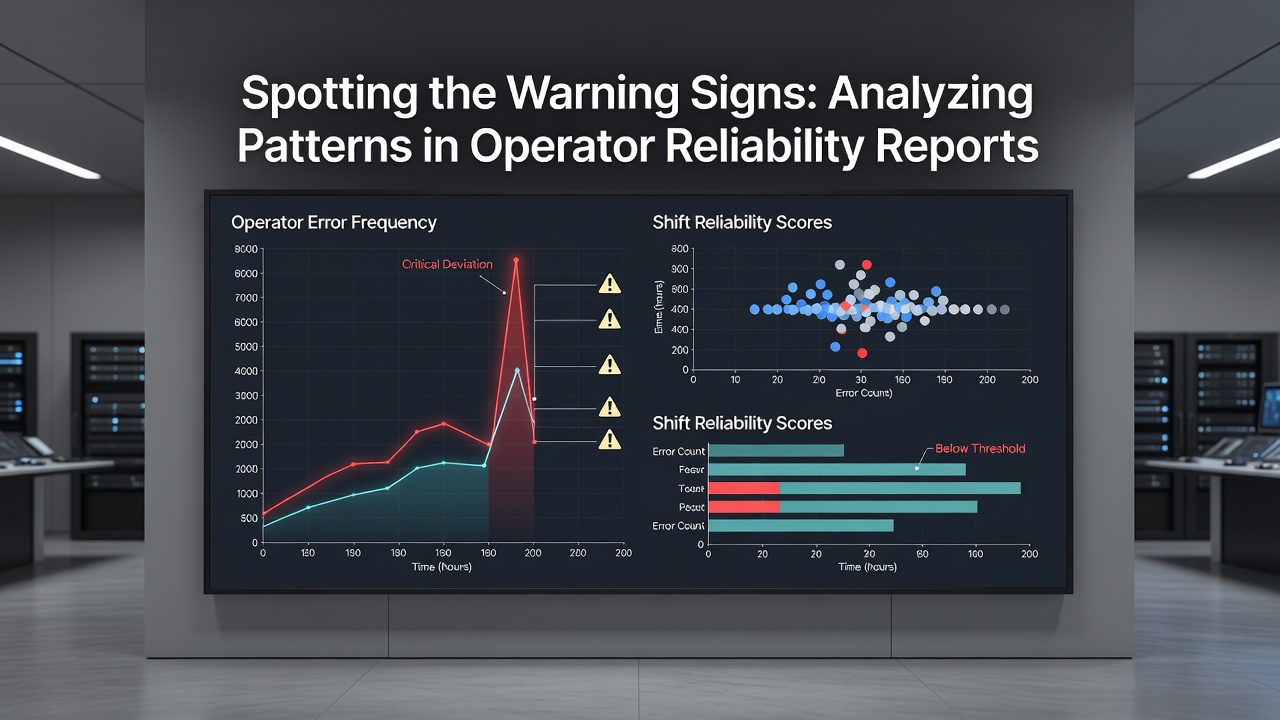
Reviewers start by extracting numerical data on dispute resolution times and charting them against complaint categories such as account access problems or bonus disputes, then apply basic trend calculations to flag operators whose metrics deviate from established baselines. Studies from research institutions show that combining this quantitative approach with qualitative notes on regulatory correspondence produces more accurate forecasts of future compliance risks. People examining these reports often create visual maps that connect repeated mentions of specific executives or third-party vendors to recurring problems in service delivery.
Additional context comes from cross-referencing reliability data with public announcements about ownership changes or platform migrations, since these events frequently correlate with temporary spikes in reported issues. Observers have documented cases where reports issued after major software updates listed higher volumes of transaction errors until systems stabilized several months later.
Geographic Variations in Reporting Standards
Different jurisdictions maintain distinct reporting requirements, so analysts adjust their comparisons accordingly when reviewing documents from European versus North American sources. Reports issued under Australian state frameworks, for example, emphasize consumer protection metrics like cooling-off period adherence, while data from U.S. state regulators focus more on financial reserve requirements and tax compliance. This variation means that patterns identified in one set of reports may require translation into equivalent terms before valid comparisons can occur across borders.
Conclusion
Analyzing operator reliability reports involves tracking quantitative indicators alongside narrative descriptions of regulatory interactions, and this process helps surface patterns that indicate sustained operational challenges. Reports issued through August 2026 and beyond continue to supply fresh data points that refine these analytical approaches, allowing observers to monitor developments in real time. External sources such as the New Jersey Division of Gaming Enforcement and studies from the Malta Gaming Authority provide foundational material for such examinations, while ongoing compilation of metrics supports consistent identification of emerging concerns.